Hello everyone my name is Alfonso Rodriguez and I'm licensed in real estate and in mortgage. This post is a real estate market update for August 2022 which means I'll be going to go over the data for the month of July 2022 while giving my opinion on where we're heading.
Below is a video where I go into more details & give 6 statistics that I keep track of. I only give a general sample of single family home that are not new construction & listed in the MLS.
If you want a detailed, personalized & professional analysis of your home or the area you want to purchase in then fill out the contact field below the video. Either myself or someone from the Realtor Fonz team will get in contact right away.
You can also call or text me directly @ 512-809-0091.
A Disclaimer Before We Start
Below you'll see data for the months from January 2017 through July 2022. This data only reflects single family homes listed the MLS during that time.
One thing to keep in mind is that we're looking into the past each month. When the data is calculated for any month it is a representation of events that happened at least 30 days before. As an example, the most recent data you'll see is for July 2022 which means homes would have contract 30 days before.
I mention this because this info is a good indication of which direction we're headed but does not reflect what's going on right now. In the real estate & mortgage world we live in things do change quickly.
Active Listings & Average Closed Price Per Square Foot
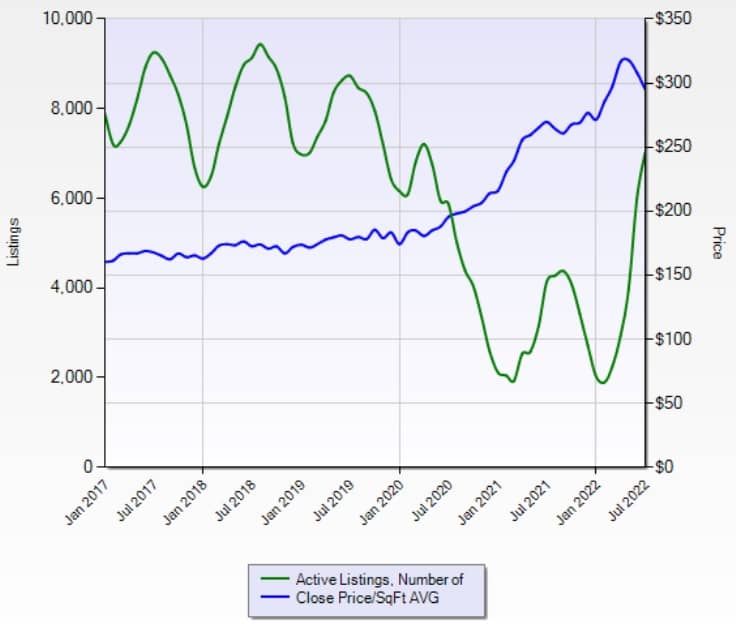
The chart below shows the average active listings & average close price per square foot for the past 5 years. The active listings is the amount of active listings during any given month & is a good indicator of what the trends are with home inventory levels when compared to previous months.
The average closed price per square foot will give a distinct perspective on what homes are eventually selling for when compared to previous months.

Active Listings
For July 2022 we had 7005 active listings which is an increase from June 2022 where we had 5980 active listings. In comparison to last year, we had 4133 active listings in July 2021. To me, this means that home inventory in the resale market is increasing. This could be due to home sellers wanting to sell their home before school starts or that there are less people buying homes right now due to interest rates. When a home is on market longer then sellers tend to do price decreases to get it sold faster.
Average Closed Price Per Square Foot
For July 2022 the average closed $/PSF was $295 which is a decrease from June 2022 where the average closed $/PSF was $308. In comparison to last year, the averaged closed $/PSF in July 2021 was $270. To me, this is a reflection of the correction we're in & will make more sense when I go over the average closed price.
Average Days On Market & Average Close Price
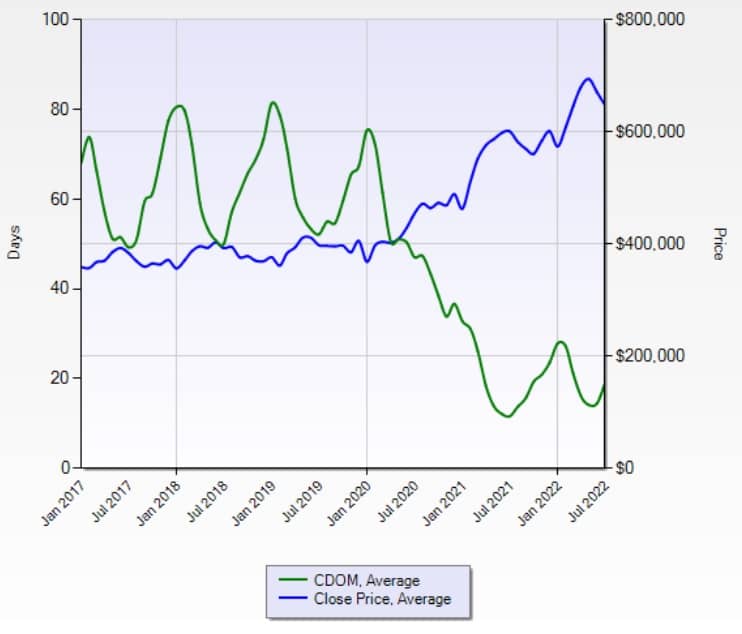
The 5 year chart & data below will show the average days on market & the average close price. The average days on market will give an idea on the average time it takes for a home to go under contract. When compared to previous months it gives insight on level of demand for homes in general & for specific areas.
The average close price is a good indicator on the demand level for specific price points. This can be used in general to see how the overall market is trending or for a specific area to determine the demand for that area.

Average Days On Market
The average days on market for July 2022 was 19 days which is an increase from June 2022 where the average days on market was 14. In comparison to last year, the average days on market was 12 for July 2021. To me, this means that home are taking longer to go under contract & since this is trending up it makes sense that we had an increase in active listings as shown above.
What I've seen are sellers testing the top end of the market hoping to get more than what the market is allowing at this time. If the home is not marketing right to attract a buyer willing to pay the asking price then sellers are likely to consider an offer less than asking. Homes that enter the market with careful planning & consideration of market trends do go under contract very quickly.
Average Close Price
The average closed price for July 2022 was $648,594 which is a decrease from June 2022 where the average close price was $670,873. In comparison to last year, the average close price was $601,501 for July 2021. To me, this means that interest rates are having a direct & large impact on what a buyer is willing to pay for a home when considering the mortgage payment.
Certain buyer are also being priced out of a certain price point due to the increase in the interest rate of their mortgage. It's important to also consider that the data for July is a reflection of at least 30-45 days prior & since the trend is downward as we head out of summer I expect the average closed price to continue the trend with price stability coming in spring of 2023.
Close to List Price Ratio & Number of Sale
The 5 year chart & data below will show the average closed to list price ratio & the total number of sales. The close to list price ratio is telling you at what price did the home eventually close for compared to the original list price & its expressed as a percentage. This is an insightful indicator of how competitive the market is trending & can be looked at in general or for a specific area.
The number of sales indicates how many homes closed. When you compare this to the number of active listings from the current month & previous months you can spot trends on inventory levels.

Close to List Price Ratio
The average close to list price ratio for July 2022 was 100.17% which is a decrease from June 2022 where the average close to list price ratio was 102.63%. In comparison to last year, the average close to list price ratio was 106.44% for July 2021. To me, this matches up with what the other data is suggesting above which is that the real estate market is cooling down.
I don't believe we're going to experience a crash but a rather a much overdue correction in prices. We've seen a rapid inflation in what home buyers are willing to pay which was fueled by record low interest rates. I still see plenty of demand in the area for homes & when prices are more in line with interest rates then we'll see the market prices stabilize.
Home sellers are still getting, on average, close to the asking price which is why it's very important to be stratigic on where you enter the market. Considering all the data above we're still considered to be in a sellers market.
Number of Sales
The number of sales for July 2022 was 2,364 which is a decrease from June 2022 where the number of sales was 3,040. In comparison to last year, the number of sales was 3,757 for July 2021. To me, this s an anomaly considering that this is for July which is considered part of the peak season in real estate. When I look past over the past 5 years in July it is about 1000 less than normal so it'll be interesting to see what the next few months look like. Keep in mind that this number is the result of at least 30-45 days prior.
My Opinion On How Things Look As A Home Buyer
Now is a great time to consider buying a new home that is already under construction. Builders are offering amazing incentives right now that include "same as cash" buyer incentives on top of rate buy downs. There are several builders that have homes either already done or will be done in the next few months.
If buying resale is preferred then there are also deals to be negotiated here also. Inventory is growing & sellers that have a home on the market for more than 2 weeks are likely to consider an offer less than asking or a seller credit to help buy down your mortgage rate. Feel free to use & play around with my online mortgage calculator.
Please watch the video below where I explain this in more detail.
My Opinion On How Things Look As A Home Seller
If you need to sell a home for whatever reason then you should consider hiring the right Realtor than will help you plan & prepare for success. We're still considered to be in a sellers market however it is not like how it had been for the last 2 years. Home's that are priced right, marketed effectively & strategically introduced to the market with proper planning will have great results from my experience.
I offer a personalized & premium service to help you achieve your goal with least amount of stress possible. I go above & beyond my clients to get them the most in both money & service.
To truly be of service to you as a home seller you really need a detailed market analysis of you home & for me to see it in person to give my professional opinion while explaining in details how I'll service your goal. Feel free to get in direct contact with me @ 512-809-0091. Please watch the video below to learn more.
I'm available to you as a resource
The information covered is a general analysis of what's going on with the central Texas real estate market. Things are changing rapidly on what seems like a daily basis so please stay tuned for future market updates.
If you want a more focused analysis of your home or the area that you want to purchase in then please do not hesitate get in touch with me directly @ 512-809-0091. I'd love to get a few minutes of your time to learn more about your situation, what your goals are, explain how I can help and give you all the information that you need to make the best decision possible.
